The Decline of Employment Protection and the Rise of Precarious Work

 By 1989, the employment landscape in the United States and Europe had changed significantly from the immediate post-Second World War decades. Between 1960 and 1973, the unemployment rate as a percentage of the total labor force averaged two percent or below in Western Europe’s big economies and 4.8 percent in the United States, but between 1990 and 1995, the average unemployment rate in the United States was 6.4 percent and between 7 and 10.7 percent in Germany, France, and the United Kindgom.1 There are a multitude of factors behind the rise but by the 1990s it was argued by national policymakers and international bodies such as the OECD and the EU that to reverse the rising jobless tide, it was necessary to loosen what was perceived as excessive and stringent regulation that was hampering growth. Deregulating employment protection laws and tightening social protection were therefore deemed necessary. These reforms to social and labor-market policies meant undoing some of the key pieces of modern labor law that had been developed through legislation, reforms of social protection policies, and collective agreements made in the post-war years. Thus, 1989 marks the start of not only fundamental political changes for the former East, but labor market changes in the former West too.
What has been the effects of these labor market changes in the United States and Europe almost 30 years on? Can we identify trends as they relate to wages, unemployment and related job precariousness as sources of inequality? It is not easy to compare labor-market conditions across national boundaries, as factors such as demographic composition, public policy, economic institutions, and labor market developments have not been identical on either side of the Atlantic.2 The objective is therefore not to directly compare the United States and Europe, but to present trends in work and wages as sources of inequality in the both from 1989 to the present day.
Wage Convergence between East and West
In Europe, there are substantial income gaps mostly between the east and the west, but also between “core and periphery.” To understand wages in the EU and what has transpired since 1989, it is important to first understand that the EU was perceived as a “convergence machine,” a mechanism that would help align wages in Central and Eastern Europe with wages in Western Europe (aligning wages with Germany being the specific goal). Between 1995 and 2008, wage convergence between poorer and richer member states was dynamic. Purchasing power and the living standards of workers were improving in the east compared to the west and this in turn was helping to narrow the wage gap between Eastern and Western Europe (Germany in particular). However, real wage growth considerably slowed down after 2010, while in-work poverty grew between 2010 and 2015 at the EU level.3 European countries that followed a policy of internal wage moderation saw wages for many groups of workers decline.4 Since the start of the financial and economic crisis of 2008, wage levels compared to Germany have fallen by 6 percent in Hungary, 5 percent in the Czech Republic and 3 percent in Poland, and remained stagnant in Slovakia.5
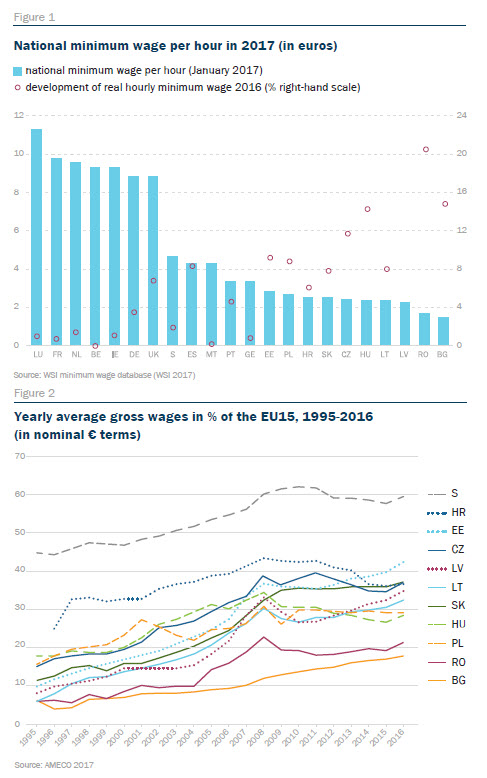
There is clearly a wide range of minimum-wage levels across the EU. Figure 1 and Figure 2 demonstrate the diversity and inconsistent convergence in terms of wages in the EU. Central and Eastern European (CEE) countries show some convergence, but the southern periphery does not. Since 2016, in particular in 2017 and 2018, wage growth in CEE picked up again but could not compensate for earlier losses. Minimum wages in the Czech Republic, Slovakia, Hungary, Poland and Romania) grew between 7 and 9 percent in 2018. Wage levels in nominal eur terms (indicative for investment decisions, labor mobility) show that wage convergence between the mid-1990s and the mid-2000s was on track but since 2008 there has been a slowdown and even a reversal in some countries.
Wage convergence between the mid-1990s and the mid-2000s was on track but since 2008 there has been a slowdown and even a reversal in some countries.
The picture among the eurozone’s strongest economies is more mixed. The three largest economies in the eurozone (France, Germany and Britain) reveal striking differences in wage development. Although labor productivity in France and Germany has grown on average by 1.5 percent over the last 20 years, mean wages have kept pace with productivity in France, but not in Germany. In fact, mean wages in Germany were barely higher in 2008 than they were in 1995.6 The difference between France and Germany in wage growth is especially striking at the bottom of the wage distribution.7 Between 1995 and 2008 wages at the 10th percentile (the lowest wages) declined by 10 percent in Germany, while increasing by nearly 20 percent in France. In contrast, wages at the 90th percentile (so the top 10 percent of earners) rose faster in Germany than in France.8 Wage growth has picked up in Germany in the post-recession years, and is beginning to align more closely to France. But the unemployment picture still provides a contrast. The unemployment rate is below 4 percent in Germany, whereas it remains stubbornly high at about 10 percent in France. 9
 Thus, in Germany wage inequality increased dramatically from 1995 to 2007. Over this period, the real median wage barely showed any improvements. The International Labour Organization found that from 2000 to 2009, real wages among German workers fell by 4.5 percent (adjusted for inflation).10 Alice Kügler and colleagues’ analysis between 1995 and 2007 shows that real wages at the bottom of the distribution declined by 13 percent, whereas real wages at the top of the distribution increased by 10 percent. But this trend of increasing inequality has slowed following the financial and economic crisis: Since 2010, workers in Germany across all parts of the wage distribution have seen considerable improvements in their wage, and wages at the bottom of the wage distribution have increased slightly more than wages at the middle and the top of the wage distribution.
In France, in contrast, wage inequality has declined over the past two decades and the biggest growth has been in the lowest-wage bracket. Real wages at the 10th percentile of the wage distribution rose by more than 20 percent between 1995 and 2014, compared to 12 percent at the median and 5 percent at the 90th percentile. Between 1995 and 2007, wages at the 10th percentile rose by 18 percent in France (remember, while declining by 13 percent in Germany). At the 90th percentile, in contrast, wage growth was more pronounced between 1995 and 2014, with 17 percent in Germany versus 5 percent in France. “Differences in the evolution of wages between France and Germany are therefore particularly striking at the bottom of the wage distribution.”11 As Kügler and colleagues argue, these trends resulted in one of the most egalitarian distributions of wages observed in France since the 1960s and can be attributed to the country’s distinctive system of industrial relations where the state declares sectoral union agreements to be binding for all firms in the sector.12
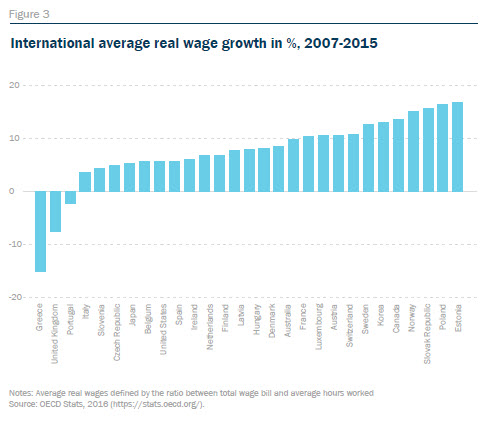
In the United Kingdom inequality has been on the rise since the 1980s. Since 1995 though, wages at the bottom, middle, and top of the wage distribution have actually evolved at similar rates.13 But this needs to be put into perspective. The United Kingdom has witnessed the biggest drop in average real wages of any OECD country except Greece; real wages of the median worker fell by almost 5 percent between 2008 and 2014. Although wages modestly bounced back in 2015 and 2016, compared with the trend of 2 percent annual growth of real wages from 1980 to the early 2000s, this nevertheless represents a 20 percent shortfall.14 Low-wage workers have benefited from minimum wage increases, especially after introduction in 2016 of the National Living Wage. They have done better than workers higher up the wage distribution, thus leading to a modest decrease in wage inequality.15 Income inequality has therefore fallen in the United Kingdom since the 2008 recession, but it remains relatively unequal by OECD standards and inequality is expected to increase over the long-term.16
Wages and Inequality in the United States
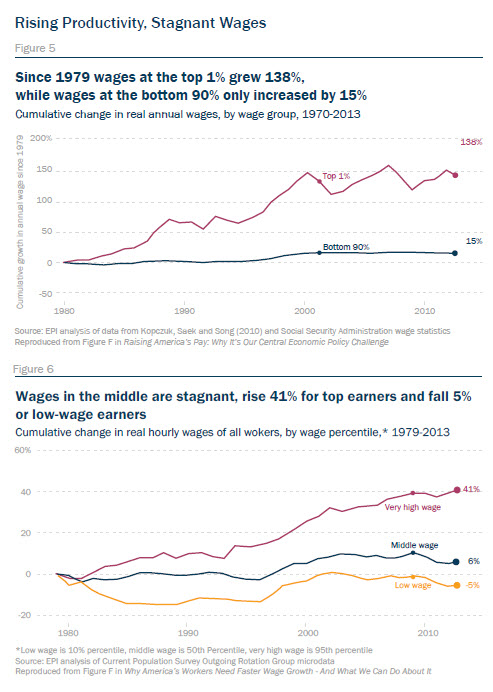
Much has been written recently about inequality in the United States.17 Rising income inequality – a reason for chronically slow growth in the living standards of low- and moderate-income Americans – preceded the 2008 financial and economic crisis and continues. As Figure 5 shows, there have been significant changes in the distribution of income since the postwar years. Incomes were more evenly distributed in the 1950s, but by the 1980s changes started to emerge. At the top of the distribution, the share in total gross income of the top 1 percent increased by one-half between 1979 and 1992, and by 2012 it was more than double its 1979 share. The top 1 percent in the United States now receives close to one-fifth of total gross income – meaning that, on average, they have twenty times their proportionate share.18
The near stagnation of hourly wage growth for a high percentage of Americans has contributed greatly to this inequality over the past generation. Given that wage-related income accounts for the majority of total income among the bottom fifth of households,19 it is not surprising that this trend has impacted U.S. living standards.
In the United States the hourly wages of middle-wage workers (median wage workers who earned more than half the workforce but less than the other half) were stagnant between 1979 and 2013, rising by just 6 percent, less than 0.2 percent per year. This wage growth happened only because wages grew in the late 1990s when labor markets got tight enough (unemployment, for instance, fell to 4 percent in 1999 and 2000) to finally deliver across-the-board hourly wage growth. Otherwise the wages of middle-wage workers were totally flat or in decline over the 1980s, 1990s, and 2000s. The wages of low-wage workers fared even worse, falling 5 percent from 1979 to 2013. In contrast, the hourly wages of high-wage workers rose 41 percent.
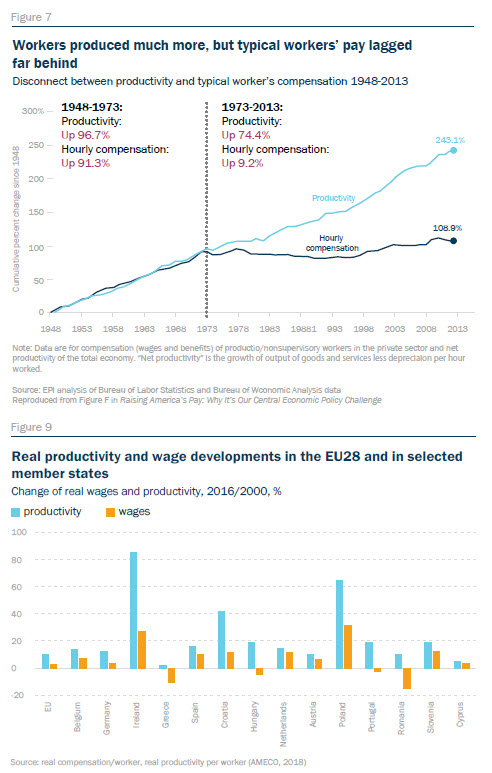
In the last decades wages have increasingly decoupled from productivity in the United States and in Europe. In theory, increased productivity (the improvements in the amount of goods and services produced per hour worked) should result in an increase in the wages and benefits received by a typical worker, especially in a tight labor market (the national unemployment rate in the United States is currently 3.9 percent, and 3.1 percent in Germany). But instead, wage growth has lagged productivity. In the United States, Figure 7 shows, between 1948 and 1973 hourly compensation of the vast majority of workers rose by 91 percent, roughly in line with productivity growth of 97 percent. But since the mid-1970s (except for a brief period in the late 1990s), pay for the vast majority lagged further and further behind overall productivity. This suggests that employers are not investing profits in their workers’ skills or wages. Absent collective bargaining to force change (or at a minimum, a federal minimum wage hike), industry is choosing not to do so on its own. This is an acute problem given that the U.S. workforce is grappling with growing income inequality and declining personal disposable income.
 In Europe, the data shows that between 2000 and 2016 wage developments were lagging productivity for the EU and for 14 member states. For the EU28, labor productivity (as GDP/worker) in 2016 was 10.5 percent higher on real terms than in 2000, while real compensation in the same period increased by a mere 2.45 per cent. Real productivity increase was thus more than four times the increase in real wages: three-quarter of the achieved labor productivity growth was not paid out in the form of wages.
More Flexible Work, More Working Poor
Nonstandard work has increased in the United States and in Europe, and it is especially affecting the low-wage and low-skilled workers. Analysis of the European Job Quality Index for the 28 EU member states shows that, parallel to changes in employment patterns, there has also been an increase in low-wage work, working poverty, and temporary employment – all indicators of precarious work. In the European context, sociologist Arne Kalleberg defines precarious employment as uncertain and insecure, and lacking in social protection and the full citizenship rights of employees in stable employment relationships.20 Unlike the voluntary flexibility enjoyed by highly skilled entrepreneurs and contract workers, precarity implies toxic, unpredictable, and anxious insecurity.
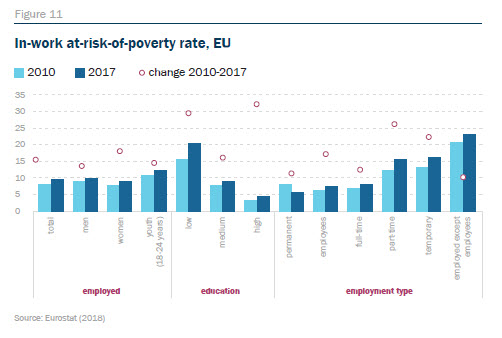
In Estonia, Portugal, Poland, Luxemburg, Spain, and Greece, at least every tenth worker was at risk of poverty.
The percentage of workers (employed or self-employed) in the total population who are at risk of in-work poverty has increased in 19 EU countries and the share of working poor was higher in 2015 than in 2005. In Estonia, Portugal, Poland, Luxemburg, Spain, and Greece, at least every tenth worker was at risk of poverty. In Romania, this was 19 percent of workers. Thus, while there was an initial decline in nonstandard forms of employment immediately following the 2008 crisis (because the least-secure jobs are generally the first to be shed in a recession), there has been a general return to temporary employment among European employers.
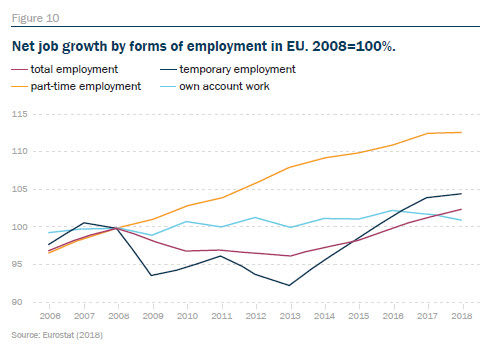
The share of temporary work in total employment increased in 18 EU countries between 2010 and 2015, reaching the highest levels in Poland and Spain, where more than one-in-four workers had contracts of limited duration in 2015. Ten of the fastest-growing jobs are in the low, low-mid, or top-paid quintiles, while jobs in the middle of the wage distribution in the United States and in Europe are shrinking fastest (though the downgrading effect is greater in the United States than in Europe).
 Jobs in some countries are going from bad to worse. Between 2005 and 2010, when the European labor market first felt the pain of the financial crisis, almost all EU countries saw a decline in job quality measured in terms of forms of employment and job security. Between 2010 and 2015, the quality of employment and job security worsened in eight countries: Cyprus, Portugal, Italy, Greece, the Netherlands, France, and Germany. A worrying development is that, in many aspects of job quality, the worst performing countries have seen a further deterioration. As a result, divergence rather than upward convergence has taken place. Indeed, against a background of poor economic prospects, employers are recruiting a much higher proportion of new employees on temporary contracts in the EU.21 In 2012, this share was around 80 percent in Spain and Poland. Therefore, the resumed growth in employment levels following the post-2008 jobs crisis has been, as Agnieszka Piasna from the European Trade Union Institute argues, a “bad jobs” recovery, marked by a return to nonstandard forms of employment with average levels of job quality in the EU remaining below pre-crisis levels.
While the data in the United States is limited, analysis by Katz and Krueger suggest a sharp rise in contingent and alternative work arrangements. Their analysis suggests that between 1995 and 2015, 94 percent of the net employment growth in the U.S. economy occurred in alternative work arrangements: independent contractors, on-call workers, temporary help agency workers, and workers provided by contract firms.22
All four categories of nonstandard work increased between 2005 and 2015. All four categories of alternative workers are paid less per week than workers in a traditional employment relationship, conditional on personal characteristics. But of the four categories, it is the independent-contractor category that earned the highest wages (though lower than their counterpart who is in a traditional work relationship).23
More than 80 percent of independent contractors and freelancers indicate they prefer such an arrangement to being in a standard employment relationship. This finding suggests that the independent contractor, who is a consultant or freelancer, has made a choice to “be their own boss.” Whereas the other three categories of workers not only work fewer hours, are paid less per hour, and fall in the low-wage quintile compared to their counterpart in a traditional employment relationship, but when asked, these categories of workers would prefer to be in a standard employment relationship as opposed to their current status. Finally, it is women who are more likely to be employed in an alternative work arrangement than men. From 2005 to 2015, the percentage of women employed in alternative work arrangements almost doubled from 8.9 percent to 17.0 percent. 24
Flexible Work, a More Precarious Future?
 Increasingly work is no longer a simple binary activity – I work or I do not work – and one’s income no longer guarantees an increased standard of living. As Tony Atkinson has pointed out, the twenty-first century labor market is more complex than simply working or not working and this complexity has implications for how we think about employment as an avenue out of poverty and full employment as a means to less inequality.25 This brief summary on the changing state of work and wages as sources of inequality provides a glimpse of trends that have happened since 1990. The question is, what has driven these trends?
There are two important points to raise when exploring the drivers of change to the quality of work and wages in the United States and in Europe. First, the changes in wage and job quality have not happened in a vacuum. Globalization, demographic (including population movements) and technological change (digitalization, automation, platform economy), and decarbonization are the four megatrends shaping labor market change in the United States and Europe. Second, the changing macroeconomic situation and the policy responses to these changes have played a major role. Other features of labor markets and employment systems, including institutional change – i.e. the decrease in the role of unions in setting quality work and wages and the flexibilization and deregulation of labor market protections (especially in Europe) – are important mechanisms that have impacted the quality of jobs and wages. Keeping labor costs down was seen as essential to remaining competitive, as well as to preventing the transfer of production elsewhere. In order to do this international bodies, such as the OECD, started to argue in favor of “labor market flexibility.” Here “flexibility” took many shapes – from wage to employment to job to skill flexibility. In Europe the deregulation of employment protection law fell under the umbrella of “flexicurity,” in particular the EU’s “better regulation agenda” and its follow-up “smart regulation agenda.”
 But the movement toward greater flexibility has resulted in a rise in nonstandard forms of work that offer less protection for workers and less predictability in terms of income and working hours. Wage gaps are therefore persistent because of changes to job quality vis-à-vis the spread of precarious forms of employment (above all temporary contracts) and are especially felt based on one’s race/ethnicity, gender and immigration status in addition to skills-set.
These changes to work and wages are particularly worth highlighting as they are amplified in the United States and Europe and have far-reaching consequences for skills development and inequality. In the United States and in Europe employment relationships since 1989 have increasingly become more flexible – or more precarious – depending on one’s point of view. Even if one takes the “flexible” view, there has been a worrying trend (from severe to moderate) toward productivity gains not accruing to wage-earners, and especially not to median and low-wage earners. As other articles in this collection argue, 1989 was supposed to be the beginning of a grand conversion, perhaps even a global conversion toward the Western post-Second World War era model of free and open societies and economies. The euro, also an upshot of 1989, was supposed to facilitate income convergence. Instead within Western economies, and between the Western economies of Europe, the decades after 1990 brought greater inequality within and between countries than the couple decades before. In the United States the top 10 and 5 percent of earners have run away with almost all of the productivity and income gains. In Europe, member states are growing slightly more equal – except for those in the eurozone, who have become more unequal. Looking ahead to the next thirty years, it is hard to imagine that these are trends that will help the United States and Europe shore up their societies and economies against strong competition.
1 2.0 percent in France, 1.9 percent in the United Kingdom, 0.8 percent in Germany and 1990-95: France, 8.6 percent in the United Kingdom and 7.1 percent in Germany, Anthony Atkinson, Inequality, Harvard University Press, 2015.
2 J. Norwood, “Labor market contrasts: United States and Europe” Monthly Labor Review: 1-7, 1983.
3 Agnieszka Piasna, “’Bad jobs’ recovery? European Job Quality Index 2005-2015,” Working Paper, 2017.
4 Martin Myant, Sotiria Theodoropoulou, and Agnieszka Piasna (eds.), Unemployment, internal devaluation and labour market deregulation in Europe, European Trade Union Institute (ETUI), 2016.
5 Béla Galgóczi, “Wage convergence in Europe has reversed since the crisis: socially unjust and economically damaging,” 2017.
6 Kügler. A., Schönberg, U. and Schreiner, R. (2018) “Productivity Growth, Wage Growth and Unions”, European Central Bank Forum on Central Banking, Volume: 2018
7 The record low levels of unemployment in Germany may have drawn in predominantly low-skilled workers into work—which would tend to lower wages at the bottom of the wage distribution.
8 Kügler. A., Schönberg, U. and Schreiner, R. (2018).
9 Ibid.
10 Global Wage Report, International Labor Organization (ILO).
11 A. Kügler, U. Schönberg, and R. Schreiner, Ibid.
12 Ibid. That said, reforms by Holland and Macron have sought to change this.
13 Ibid.
14 Costa, R. and Manchin, S. (2017) “Real Wages and Living Standards in the UK” Paper EA036 Center for Economic Performance, LSE.
15 Ibid.
16 A. Hood and T. Waters “The Impact of Tax and Benefit Reforms on Household Incomes”, Institute for Fiscal Studies Briefing Note BN196, 2017.
17 Income, i.e., labor income in the U.S. is defined as the amount a person enters on their income tax return. Labor income is income obtained through wages earned by participating in the labor market. Non-labor income includes capital income, private transfers and state transfers.
18 It is important to point out that in the US, the proportion of total gross income going to the top 1 percent began to increase long before 1970. Between 1952 and 1972, the relative advantage of the top decile rose from 150 percent to 194 percent of the median; equivalent to the increase that occurred between 1972 and 2012. The difference between the two periods, however, is that the U.S. maintained a broadly stable level of household income equality in the 1950s and 1960s, despite widening earnings dispersion.
19 After all, the vast majority of Americans rely on their paychecks to make ends meet. For these families, the bulk of income comes from wages and employer-provided benefits, followed by other income sources linked to jobs, such as wage-based tax credits, pensions, and social insurance. Lawrence Mishel, Elise Gould, and Josh Bivens, “Wage stagnation in nine charts,” Economic Policy Institute 6, 2015.
20 Good jobs, Bad jobs, New York, Russell Sage Foundation, 2011.
21 Up to 50 percent between 2010 and 2012 compared with 40 percent in 2002.
22 F. Katz and A Kruger, “The Rise and Nature of Alternative Work Arrangements in the United States, 1995-2015” Working Paper 603, Princeton University, Industrial Relations Section, September 2016.
23 Ibid.
24 Ibid.
25 Atkinson, A. (2015) Inequality.